Spatio-temporal and Events Based Analysis of COVID-19 in Twitter

Social media platforms are increasingly being used for the analysis of human behavior. Twitter is a great platform for users to share comments and update their status. The COVID-19 pandemic is a prime example of this; there were more than 628 million COVID-19 related tweets at the time of writing the document.
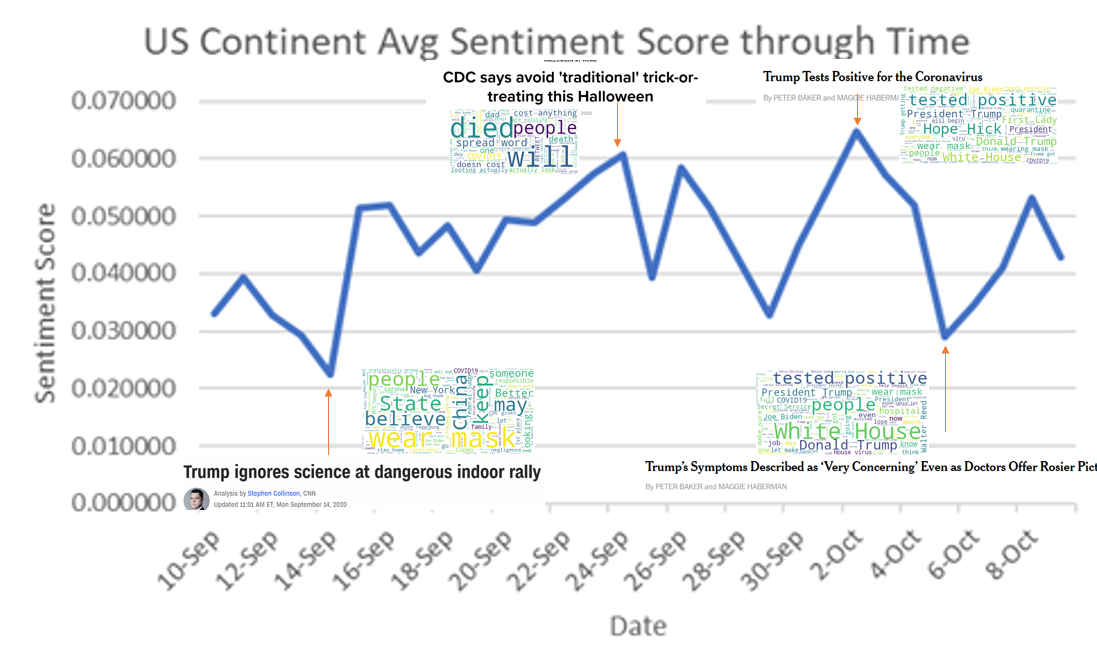
This project analyzed tweet data in the US continent from September 10, 2020, through October 9, 2020, spatially and temporally to find out how the public reacts to the COVID-19 pandemic on Twitter.
Twitter Data Mining & Sentiment Analysis
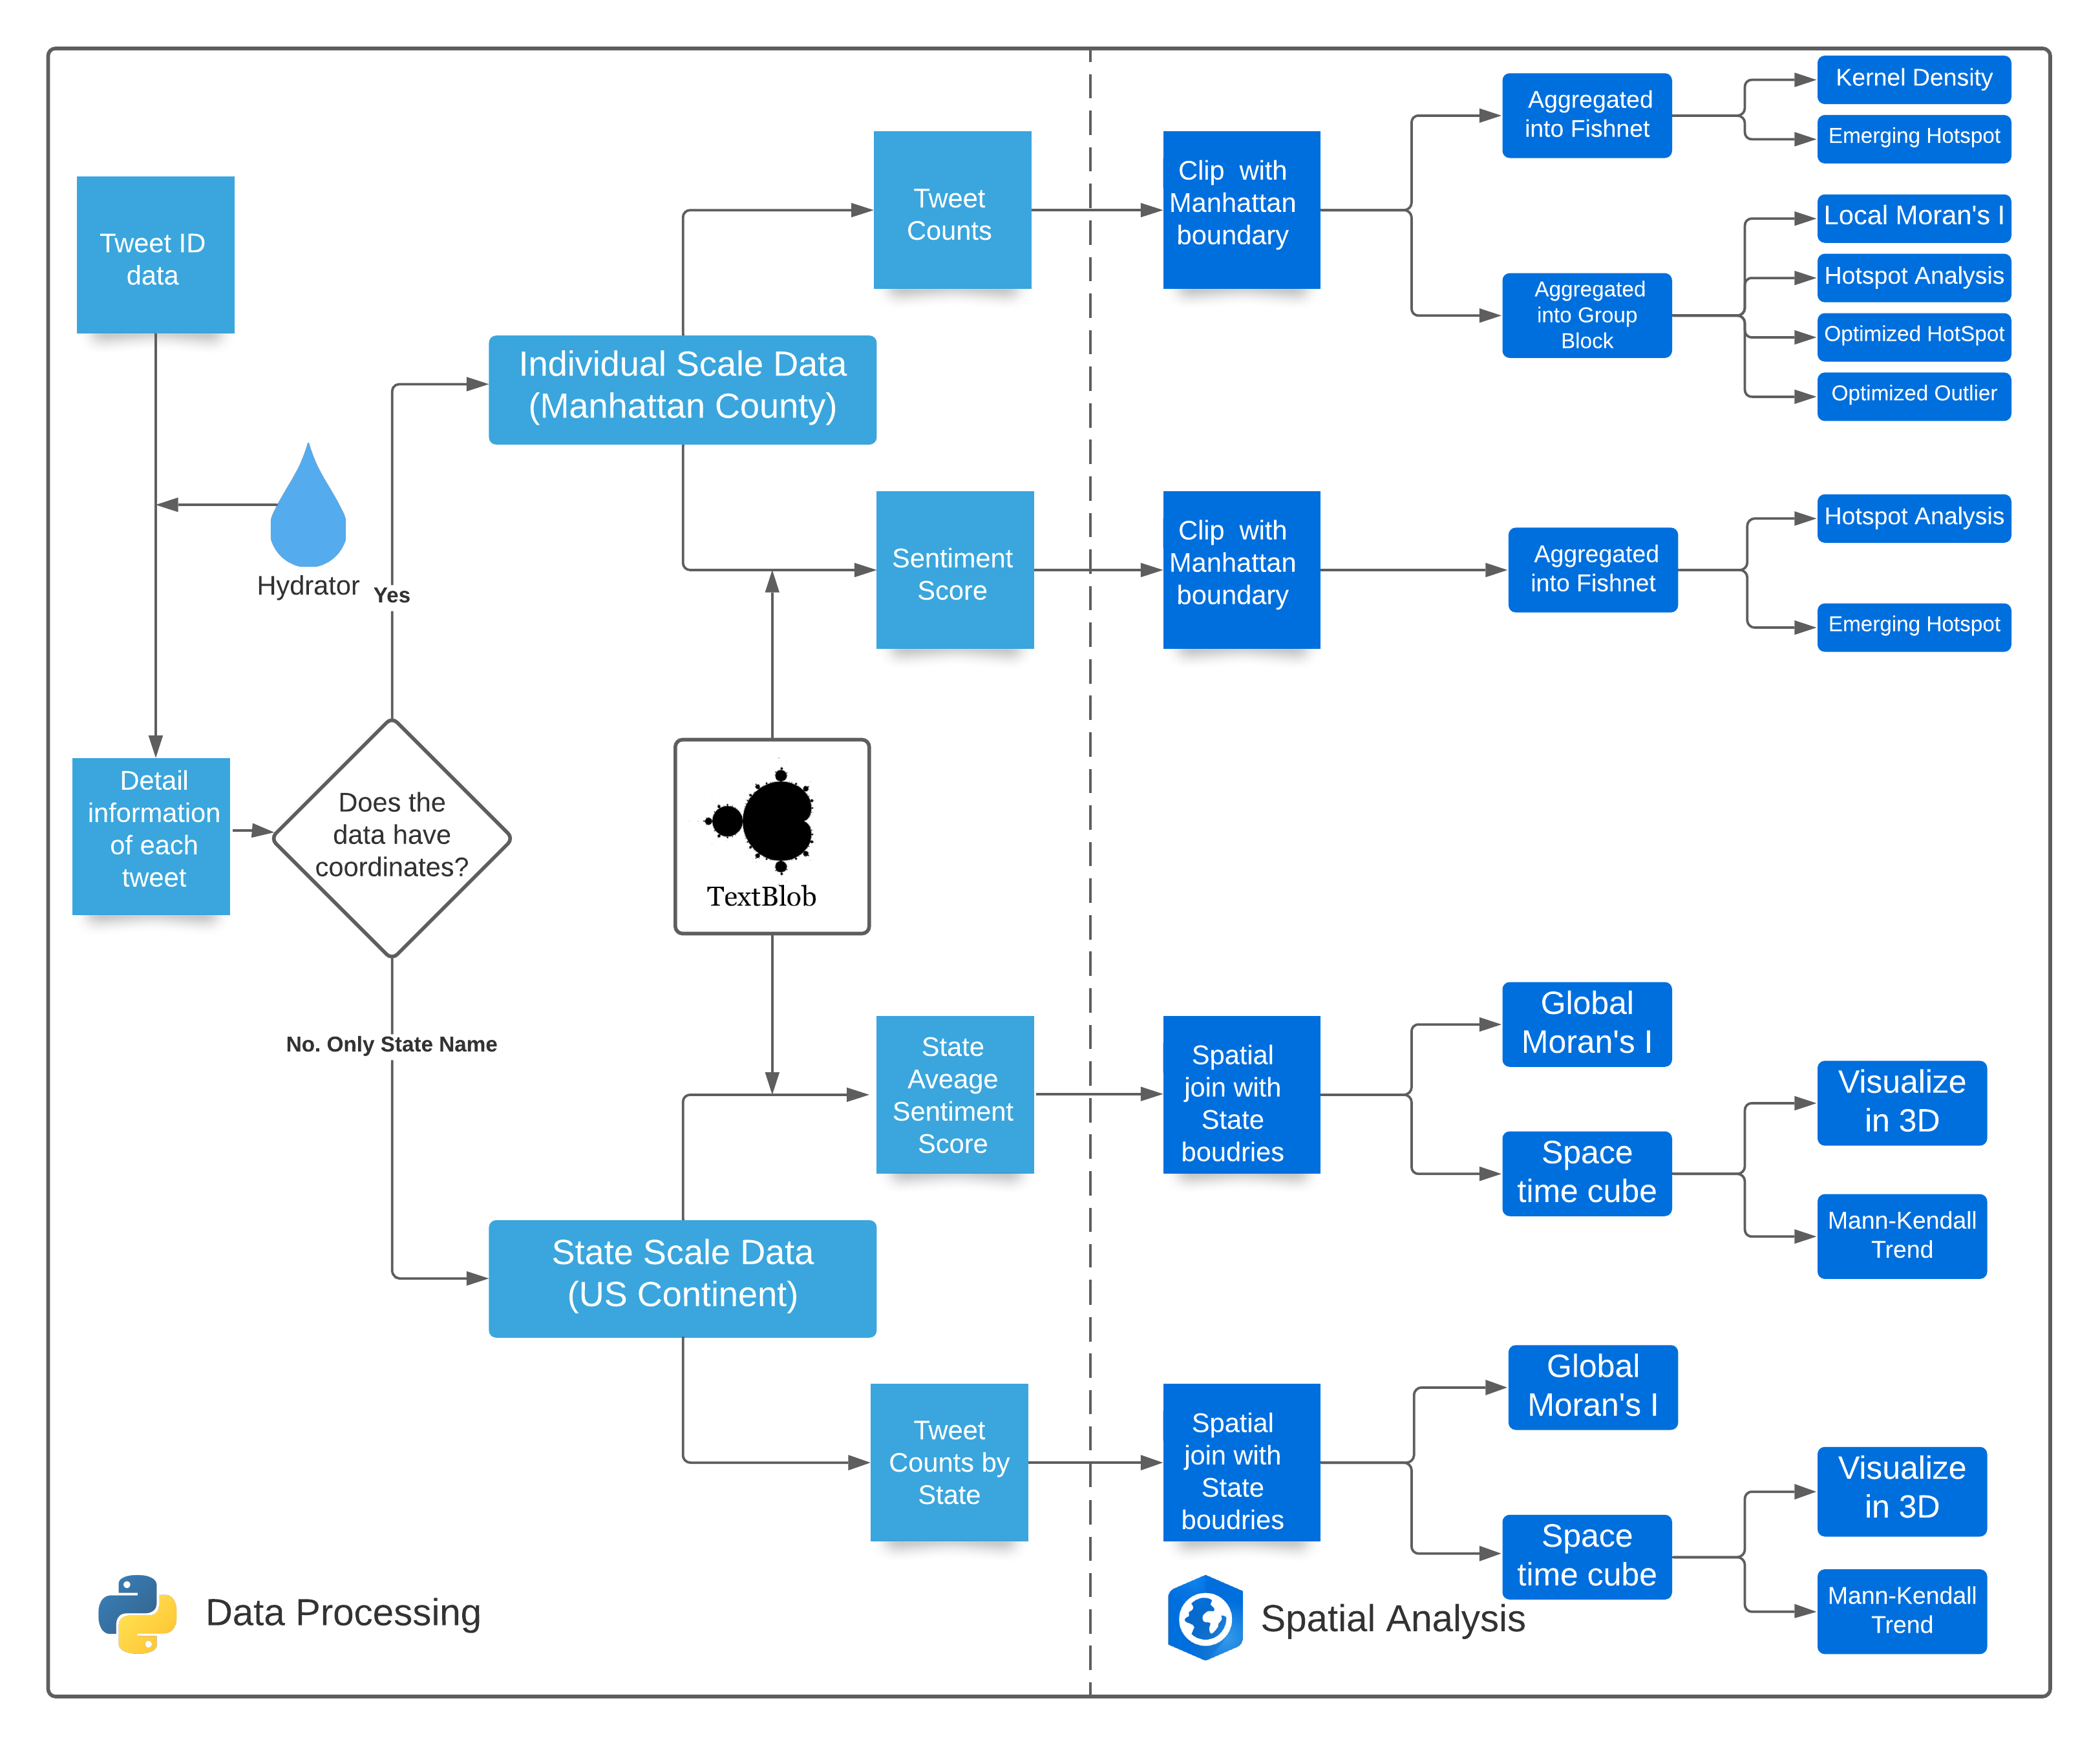
The data was derived from the research of Chen etc., their research extracted tweets by the keywords and incrementally added keywords based on the conversations occurring on Twitter at any time. They saved COVID-19 related tweets on GitHub. We used the software named Hydrator to extract tweets by tweet IDs and saved them by day.
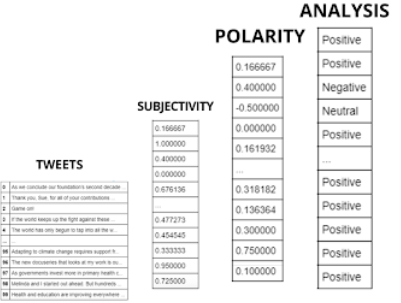
To extract sentiment information from tweets, we used a natural language processing python library called TextBlob, to perform sentiment analysis for each fetched tweet. This python library uses a machine-learning algorithm in Natural Language Toolkit (NLTK) to construct a dictionary that contains a complete list of emotional features. This dictionary contains not only words but also includes sentiment-laden acronyms, phrases, and emoticons. All the features within a tweet were rated for the polarity and intensity on a scale from “-1: Extremely Negative” to “+1: Extremely Positive.” Any features in the tweets that are not listed in the dictionary will be scored as “0: Neutral”. The average score is then used to represent the sentiment indicator for each feature in the dictionary. The sentiment score data could help us to further understand Twitter users’ reactions regarding events that happened during the COVID-19 pandemic.

Spatial and Temporal Analysis
Spatial analysis was divided into two different scales: state scale and individual scale. We analyzed the tweet counts and sentiment score on both scales. We used the Mann-Kendall trend analysis and applied Global Moran’s I for tweet counts and sentiment. On the individual scale, we focused on the data in Manhattan, NY. Local Moran’s I, density mapping, and hotspot mapping, etc. analysis methods were implemented to find the spatial pattern.
On the state scale, the distribution of tweet density was found to be dispersed; the distribution of sentiment score was found to be clustered. Political factors seem to be one of the elements that affect people’s reactions to Twitter because almost all the states highlighted in the Mann-Kendall Trend results tend to vote for the republican party. However, further research is needed to support this idea.

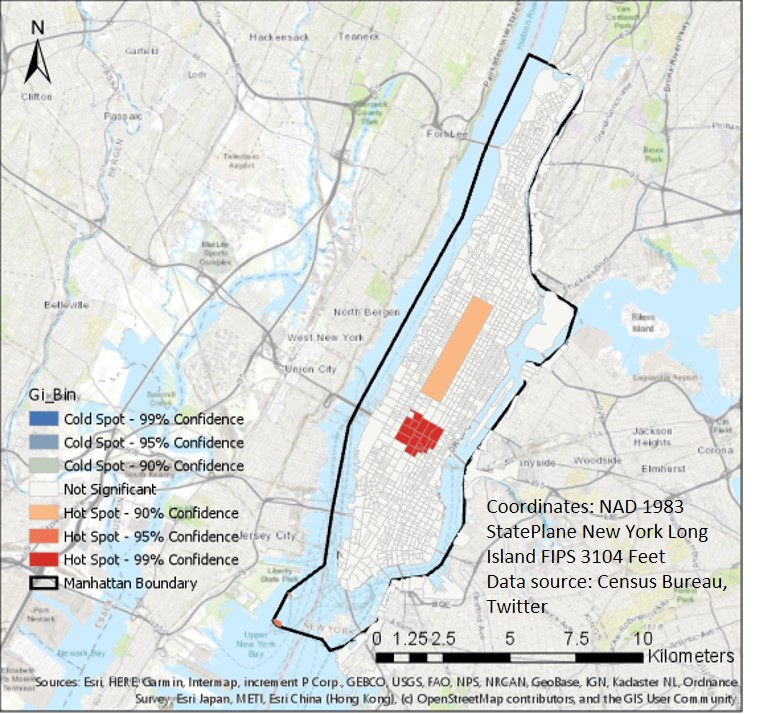
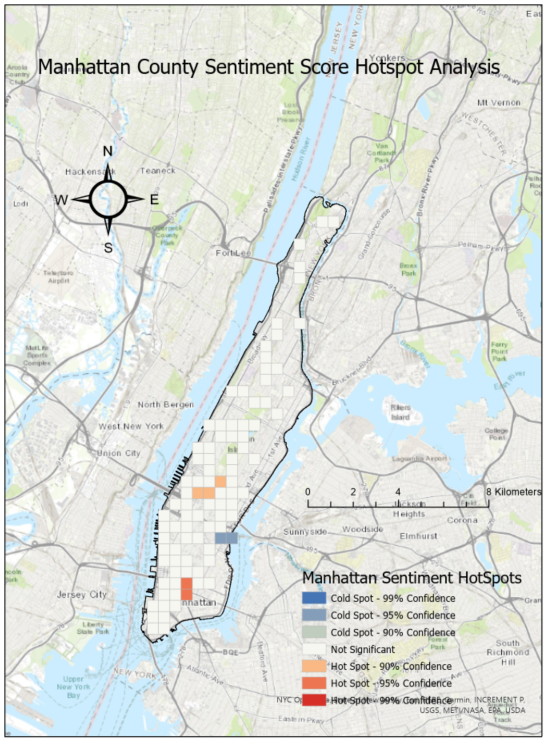
On the scale of Manhattan county, areas with high population density tend to have high tweet counts. However, Times Square and Central Park have high tweet density. People in northern Manhattan seem not to like to share their ideas about COVID with the coordinate information. Places like hospitals, restaurants, and shops, etc. tend to be highlighted in Hot Spot analysis.
Factor Analysis
To understand factors that caused the spatial patterns we previously discovered, we used a python library WordCloud to further dive into the tweet data.

The most frequent words were used to search for news on days that had high or low sentiment scores. Results show that breaking news could have affected people's emotions on Twitter.
Limitation
Spatial analysis on Twitter data has limitations in representing the real world because only a few percent of Twitter users share their location. Also, this project may only reflect some of the perspectives of Twitter users because there is a lot more population that doesn’t use Twitter for social networking. However, spatial analysis on tweet data is still helpful for understanding people's behaviors and responses during the COVID-19 pandemic.